To Announcements
IT 403 -- Takehome Midterm Exam
Posted: October 5, 2016
- This exam is due on Wednesday, October 12, at 6:00pm. It cannot be submitted late.
- Include this statement at the top of your submission:
"I completed the midterm exam entirely by myself without the
assistance of any other persons." 5% penalty if you omit this statement.
- The total number of points for this exam is 210.
The score that you obtain will be multiplied by 100 / 210 to obtain a score
out of 100.
Part A. Multiple Choice Questions
For each question, you may give a reason or show work for partial credit.
You are required to give a reason or show your work if the question is marked with an asterisk (*).
Questions 2, 3, 4, 5, 7, 8, and 11 require you to show a reason or work.
5 points each.
- What is the SPSS name for a categorical variable?
a. Nominal
b. Ordinal
c. Quantitative
d. Scale
- *Which of the following could NOT easily be studied using a controlled experiment?
a. Does a dietary supplement for dogs produce better teeth?
b. Does a new diet pill cause persons to lose weight and keep it off?
c. Does a new vaccine prevent persons from contracting AIDS?
d. Does choice of political party influenced by religion?
- *Using the Tukey's Hinges method, the IQR for the list 32 57 59 79 94 104 186 is
a. 15 b. 41 c. 47 d. 154
- *The SD+ for the list 7, 11 is
a. 2.000 b. 2.828 c. 7.414 d. 8.000
- *If SD+ for a list is 46.32 when n = 17, what is SD for this list?
a. 41.87 b. 44.94 c. 45.01 d. 47.01
- The distance between the inflection points of a normal histogram is
a. σ
b. 2σ
c. μ-σ
d. μ+σ
- *Heights for human males are normally distributed with mean 5’8" (68")
and SD = 3". How many persons out of one million (106)
have a height over 6'8" (80")?
a. Less than 1 b. 3 c. 32 d. 133
- *What is the 99.9th percentile for the male human heights in Problem 7?
a. 6'3" b. 6'5" c. 6'7" d. 6'9"
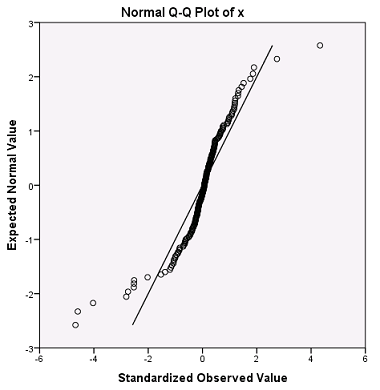
- What does the following normal plot indicate?
a. Skewed to right b. Skewed to Left c. Thick Tails d. Thin Tails
- The scatterplot of a bivariate normal dataset looks like:
a. an ellipse-shaped point cloud
b. a circle-shaped point cloud
c. a rectangle-shaped point cloud
d. a bell-shaped curve
- *Compute correlation by hand of the x and y-variables:
x: 1 2 3 4 5
y: 1 3 4 2 5
If you use SPSS, show a printout of the computed variables.
a. 0.0 b. 0.4 c. 0.56 d. 0.7
- The proportion of variation of the dependent variable that can be
explained by the variation of the independent variable is
a. r b. r2
c. r SDx SDy
d. r / (SDx SDy)
Part B: A Histogram
| Bin1 | Height2 |
| [10, 20) | 1.0 |
| [20, 40) | 1.5 |
| [40, 50) | 4.0 |
| [50, 90] | 0.5 |
1 Bin = Histogram interval
2 Units of Height: Percent per horizontal unit.
Using the preceding summary table, work the problems below.
Remember that the area of each histogram rectangle
is proportional to the percentage of observations in the bin that forms the
base of each rectangle.
- (10 pts.) Draw the histogram. If you draw the histogram with
typewriter graphics
like the answers to the histogram problems in the lecture notes,
use a monospaced font like Courier New or Lucida Console. Alternatively, you can draw the
histogram with pen on paper and scan it in for your submission.
- (10 pts.) Compute Q1, Q2, and Q3 for the histogram.
- (5 pts.) Compute the mean of the histogram using a weighted average.
- (5 pts.) Estimate what percentage of observations are found in the bin (30, 50].
- (5 pts.) The list shown below represents the smallest and largest numbers
that are summarized in the summary table for this problem.
(The numbers that are not shown in this list are clearly not outlier
candidates.)
Draw the boxplot based on this list and on the quartiles computed in Part 2.
Show your calculations for the inner and outer fences that you use to
classify the outliers
10.11 10.16 10.23 10.48 10.98 ...
... 74.01 73.55
76.98 88.34 89.98
Note: computing the boxplot from the raw dataset would be more accurate
than estimating the quartiles from the histogram, but this is the best
that you can do if you don't have access to the entire raw dataset.
Part C: Essay Question
- For full credit, write in full sentences with an introduction and a
conclusion. Your essay should be about 2/3 to one page. Cite any outside sources
if you use them, online or otherwise.
- (20 pts.) Explain the differences between a controlled study and an
observational study. You may wish to use these terms in your discussion:
randomization, double blind, lurking variables, scientific sample.
Part D: SPSS Analyses
- Univariate Analysis. The Undergrads column of the
ugrad.xslx dataset contains the number of undergraduates currently enrolled in colleges or universities in each state of the United States.
Do the following with SPSS. Questions with a * require a typed response in addition to the SPSS output.
- (10 pts.) *Find the following statistics for the Undergrads variable:
Q0 Q1 Q2 Q3 Q4 SD+ IQR
- (10 pts.) *Create the boxplot for the Undergrads column. Identify the mild and extreme outliers in the dataset.
For each outlier that you identify, also identify the corresponding state.
- Regression Analysis. The PercentAlcohol and Calories columns
of the dataset beer.xslx dataset are the percentage of alcohol the number of
calories in 12 fluid ounces of beers of various brands. Use SPSS to do the
following problems. Don't compute anything by hand for this section. Questions marked with * require
a typed response in addition to the SPSS output.
- (10 pts.) *Find the sample mean and SD+ for the variables PercentAlcohol
and Calories. Also find the correlation between these variables.
- (10 pts.) *Use the SPSS output to find the regression
equation for predicting Calories from PercentAlcohol. How many calories would you expect a
beer with 8.5% alchohol to have?
- (10 pts.) *Create the residual plot. What does this plot
tell you about the residuals?
- (10 pts.) *Create the normal plot of the residuals.
What does this plot tell you about the residuals?
- (5 pts.) *In your opinion is the linear regression model for
predicting Calories from PercentAlcohol a good model?
Part E: Regression Problem
- Show your work for full credit. (For each question * = show your work).
The birth lengths (x-variable) and birth weights (y-variable) of a
population of full term infants are bivariate normal with the following
summary statistics:
x = 50 cm SDx+ = 1.5 cm
y = 3.5 kg SDy+ = 0.4 kg
r = 0.866025
- (5 pts.) *About what percentage of the infants have birth weight
greater than 4.4 kg?
- (10 pts.) *Find the regression line for predicting the birth
weight from birth length.
- (5 pts.) *What is the predicted weight for an infant with birth
length 53 cm?
- (5 pts.) *Calculate the root mean squared error (RMSE).
- (5 pts.) *Of those infants with birth length 53 cm, what
percentage have birth weight greater than 4.4 kg?