- Unbiased The average of the observations in every thin vertical strip is the same all the way across the scatterplot.
- Biased The average of the observations changes, depending on which thin vertical strip you pick.
- Homoscedastic The variation (SD+) of the observations is the same in every thin vertical strip all the way across the scatterplot.
- Heteroscedastic The variation (SD+) of the observations
in a thin vertical strip changes, depending on which vertical strip you pick.
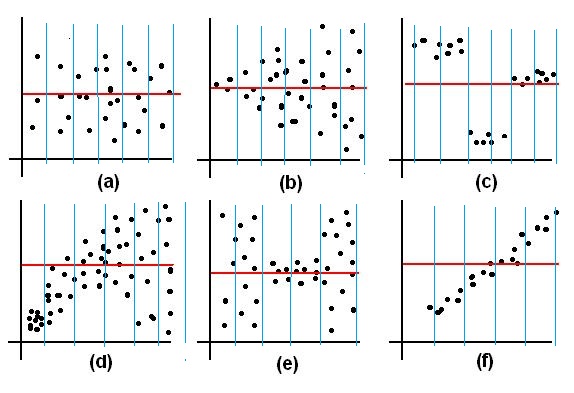
Ans: (a) unbiased and homoscedastic, (b) unbiased and heteroscedastic, (c) biased and homoscedastic, (d) biased and heteroscedastic, (e) unbiased and heteroscedastic, (f) biased and homoscedastic.
The Normal Distribution
Practice Problems
- Work problems from the Practice Problems on the Area under the Normal Curve.
The Standard Error of the Average
Normal Plots
- This section will be discussed next week on Sept 28.
- Normal plots can be used to determine if a dataset is approximately normal, or how a dataset deviates from normality.