# Set the working directory to "C:/workspace".
setwd("C:/workspace")

# Check the resulting working directory.
# It should be "C:/workspace".
getwd( )

# Display all files in the working directory
dir( )

# Create an R dataframe from the CSV file
# nist-10.txt. CSV means comma separated value.
weightDf <- read.csv("nist-10.txt")

# Print the resulting data frame.
print(weightDf)

# Extract the Weight column from the dataframe:
w <- weightDf$Weight

# Print the extracted weight vector w.
print(w)
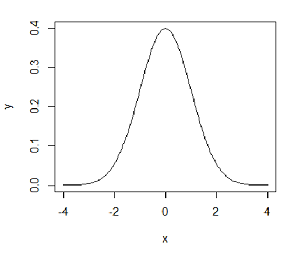
x <- seq(-4, 4, 0.05)
y <- dnorm(x)
plot(x, y, type="l")
Answer: Here is the resulting R graph of the normal density:
Answer: Create one histogram with equal bin widths: [0, 1], (1, 2], and another histogram with unequal bin widths: [0, 1], (1, 4].
x <- c(0.5, 0.5, 0.5, 1.5, 1.5)
b1 <- c(0, 1, 2)
b2 <- c(0, 1, 4)
hist(x, breaks=b1, main="Equal Width Bins")
hist(x, breaks=b2, main="Unequal Width Bins")
The resulting histograms:

For the Equal Width Bins histogram, the vertical axis label is Frequency and the vertical units are the counts in each bin; for the Unequal Bin Widths histogram, the vertical label is Density and the vertical units are fraction of observations per horizontal unit.
Ans: a critical point of a curve is where the slope of the curve is horizontal For a normal curve, the x-value of the critical point is the maximum value of the curve. The normal curve is symmetric around the center.
Answer: an inflection point of a curve is where the curve changes from concave down to concave up, or vice versa.
Answer: the sample mean is another name for the sample average. If x1, x2, ... , xn is the dataset, the sample mean is the sum of the observations divided by the number of the observations:
X = (x1 + x2 + ... + xn) / n
