Answer: proj1Smith.docx (replace with your last name)
| a. Fisher | 1. First Stated the Central Limit Theorem |
| b. Cotes | 2. Tried to find the "ideal man" that nature was trying to produce |
| c. Tukey | 3. Was the first demographer to use statistics. |
| d. de Moivre | 4. Coined the term "exploratory data analysis." |
| e. Pascal | 5. Father of modern statistics. |
| f. Gauss | 6. First described the least squares method. |
| g. Graunt | 7. First studied the theory of errors applied to astronomy. |
| h. Galton | 8. First applied the theory of probability to gambling. |
| i. Quetelet | 9. Introduced the concept of correlation. |
Answer: a. 5; b. 7; c. 4; d. 1; e. 8; f. 6; g. 3; h. 9, i. 2.
Answer: A variable that is not included in the dataset, but should be. Another name for a lurking variable is a confounding variable.
Answer: a clinical trial should be randomized to minimize the effect of lurking variables. The randomization insures that effects due to variables not included in the dataset are similarly distributed between both the treatment and the control group. A clinical study should be double blind so that psychological effects that result from the patient knowing that he or she has received the treatment vs. knowing that he or she has received the placebo. The doctor treating the patient should also not know whether that patient has received the treatment or the placebo.
Answer: In a controlled experiment, each subject is randomly assigned the treatment or placebo, to reduce or eliminate the effect of lurking variables. In an observational study, no experiment is performed. The data is just reported and analyzed "as is."
Answer: categorical: gender (M, F, X (non-binary), ordinal: year in college (1, 2, 3, 4), continuous: height.
Answer: the c function, which means combine. For example:
x <- c(4, 2, 7, 5)
Answer: <-, for example,
x <- c(4, 2, 7, 5)-> is also the assignment operator:
c(4, 2, 7, 5) -> xbut -> is not often used
Answer: False, R vectors are one-based, which means that the indices of the vector elements start at 1, not 0. Most other modern computer languages use zero-based indices because they are computationally more efficient. Examples of languages that use zero-based indices are Python, Java, and C#.
38 54 52 49 65 58 103 12 70Answer:
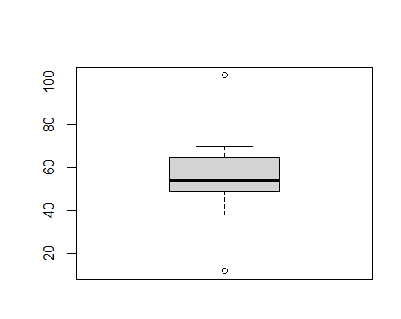
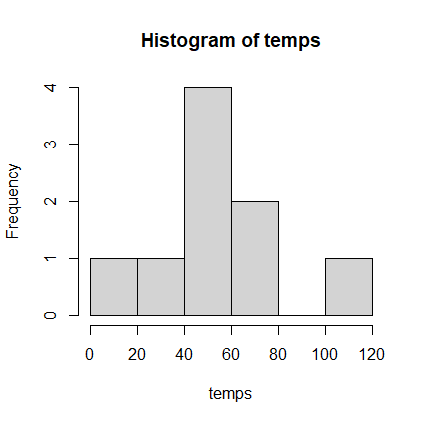
> temps <- c(38, 54, 52, 49, 65, 58, 103, 12, 70)
> summary(temps)
Min. 1st Qu. Median Mean 3rd Qu. Max.
12.00 49.00 54.00 55.67 65.00 103.00
> quantile(temps, prob=c(0.0, 0.25, 0.5, 0.75, 1.0))
0% 25% 50% 75% 100%
12 49 54 65 103
# R statements and console output
> stem(temps)

  The decimal point is 1 digit(s) to the right of the |

   0 | 2
   2 | 8
   4 | 9248
   6 | 50
   8 |
  10 | 3

> hist(temps)
> boxplot(temps)
Histogram:
Boxplot: